
多端互动,沉浸创新——深圳·星河WORLD BIM数字孪生招商中心跑出招商“加速度”!
2023-02-23 | 浏览9792
*本文选自知优科技于Civil + Structural Engineer 2021年9月刊文.
By George Broadbent, Dr. Jeff Chen, Dr. Eve Lin with Kai Yin, and Jiayi Yan
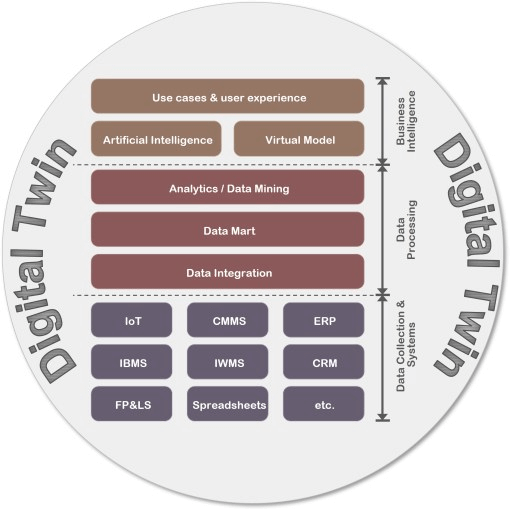
Modularized Framework for a Digital Twin. Credit: George Broadbent, Dr. Jeff Chen, and Dr. Eve Lin
Introduction
In the previous article, “Beyond Level of Detail into AM/FM,” we discussed the current development of the Digital Twin concept in the architecture, engineering, construction, and owner (AECO) industry, focusing on end users’ demands. In addition, a “3×3” rule was introduced to highlight the flexibility and adaptivity a user-oriented Digital Twin should include. This article takes a deep dive and breaks down the general Digital Twin framework into five application modules: Asset Operation, Asset Maintenance, Safety, Real Estate, and Sustainability, with the capability of data analytics and reporting, respectively. The collaboration of these five modules is an essential component to support the project’s operational phase from both operation and maintenance (O&M) and data perspectives.
Modularized Digital Twin Framework
The new digital era welcomes technologies like data science, state-of-the-art gaming engines, the Internet of Things (IoT), Artificial Intelligence (AI), and so on. Realistically, an ideal Digital Twin platform would better connect with, and take advantage, of multiple systems/services. The list includes but is not limited to: Enterprise Resource Planning (ERP), Customer Relationship Management (CRM), Integrated Building Management System (IBMS), Fire Protection and Life Safety (FP&LS), space management, Integrated Work Management Systems (IWMS), and Computerized Maintenance Management System (CMMS).
As shown in Figure 1, the modularized framework consists of three layers: Data Collection & Systems, Data Processing, and Business Intelligence, which allow data consumption to support each system while enabling business intelligence through a well-connected data processing gateway. Data and standardization should be implemented across all connected channels via data gateways and a data mart. Data mining, analyzing, reporting, or machine learning integration would be utilized to fulfill the demands of all stakeholders during the operational stage. Finally, AI could be used as the ideal human-computer interaction (HCI) process to understand users’ natural language, collect, and analyze corresponding data from related connected channels, and provide answers to the user. We will discuss AI applications in-depth in the upcoming articles.
The five identified modules that can encompass a holistic Digital Twin are Asset Operation, Asset Maintenance, Safety, Real Estate, and Sustainability. Each of the modules has been defined to work separately and collaboratively to support the operational stage as illustrated in Figure 2. We will begin to see how the virtual geometry of the building/facility blends with the operational data through these five modules. It is through this merging that the long-term benefits of BIM are realized. The goal of BIM implementation in the operational stage is to portray a digital representation of the real world, the Digital Twin. While traditional BIM for design and construction will have a useful life of zero to five years (i.e., design and construction), the Digital Twin (BIM extended into operations) can expand it from 20 to 30 years, sometimes even 50.
Asset Operation Module
The Asset Operation Module performs general management practices on equipment running across the facility, enhances overall productivity, and reduces asset downtime. The module uses the integrated data model, analytics, and management workflow. Compared with a traditional O&M workflow, this data-driven workflow can detect and predict potential risks and enhance the facility’s performance.
The operation monitoring tools are introduced to help the user record, analyze, and identify risks, failure probability, and related consequences with data aggregated from the entire facility, a single room, an asset system or a single piece of equipment. This can overcome the drawbacks of a traditional fixed O&M workflow. A user predefined problem, cause, remedy (PCR) data library can be linked with specific asset classes or locations to provide more suitable decision-making suggestions. Meanwhile, real-time sensor readings, if available, need to be integrated and standardized via the data gateway into the global data mart. Machine learning-based algorithms will examine these data with a pre-trained digital brain to identify the likelihood of failure within a certain amount of time. The result will be reported to the end-user in different modes (3×3 rules) and formats.
Long-term data management is a critical part of this module. The operation history of various vital assets will be monitored and analyzed against their designed use cases. For example, at a micro-level, the analysis tool will determine if critical assets are beyond their useful life, or detect an operational defect. Another example from the macro-level occurs when an area is subject to an abnormally high number of asset failures. These breakdowns will be highlighted on the dashboard, so subject matter experts can investigate the root cause such as zone temperature settings or poor maintenance by a contractor.
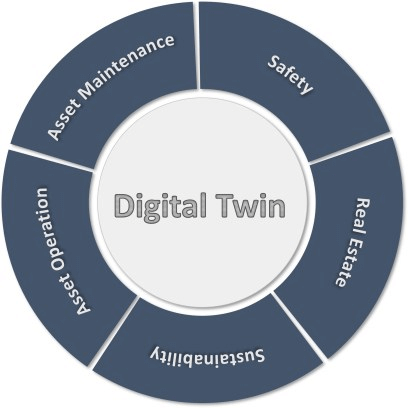
Five Modules of a Digital Twin. Credit: Geroge Broadbent and Dr. Eve Lin
Asset Maintenance Module
The Asset Maintenance Module comprehensively manages repairs and work orders in the facility by collecting work order information based on equipment status. It also continuously optimizes repair status. The work order analysis and notification system provide different levels of alarms based on each work order’s criticality and urgency. It categorizes them based on accumulation, processing time, frequency, etc. on the facility’s 3D model. The intuitive visualization, grouping, and prioritization can support implementing different management strategies while improving the efficiency and effectiveness of processing work orders.
Although lack of maintenance causes a lot of waste in building operation and maintenance, excessive maintenance is also a source of unnecessary discarded materials. The utilization of the Maintenance Management Module enables facility managers and operators to balance their workforce and better allocate and relocate resources. The module collects all maintenance data and uses different analysis tools to conduct varying equipment, space, floor, and building analyses. Utilizing comparison and visualization of the maintenance frequency and actual damage numbers to isolate the equipment and areas can decrease operation and maintenance costs. Reducing waste caused by excessive maintenance leads to achieving efficient facility operation and maintenance.
Ideal O&M management goes beyond the traditional scope as it relies on well-defined preventive and timely corrective maintenance. It will utilize technology like data science and IoT to detect anomalies in operation, possible defects in equipment and processes while reporting these findings in an adaptively interactive way to help stakeholders make better decisions. The data-driven Predictive Maintenance distinguishes the Digital Twin from an ordinary BIM to FM framework since it incorporates the data from various services/processes and data analytics to identify when failures will occur.
Safety Module
The Safety Module manages the facility’s fire safety, surveillance, security, and similar systems to ensure the facility’s overall safety while preparing for hidden hazards and emergency responses. The integrated platform can display information from these systems and provide a comprehensive view of the entire campus or facility by tying into the video surveillance systems. With access to safety-related equipment’s locations, maintenance, inspection records, and other related information, the module can quickly identify, locate, and trigger the security alarm when the equipment breaks down or goes offline and provide health analysis based on its warranty status.
Furthermore, the platform can visualize the failure or problematic event with varying colors, distribution, patterns, and frequencies to support effective safety management. Understanding the failure pattern in different dimensions and combining targets to establish management strategies provides a solid basis for improving the facility’s safety and security while avoiding redundant work and efforts. Compared with the traditional management method, the integrated module provides users with an informed decision-making foundation by utilizing relevant data and analyses to screen valuable information, unveil hidden issues, and deliver possible causes and potential solutions.
For example, when a heat map rendering of the carbon monoxide (CO) analysis reveals the concentration and distribution of CO and where it might be accumulated, the facility manager can identity the pollution sources accordingly and implement corresponding measures such as exhaust air ventilation. Also, real-time visualizations of parking space usages, patterns, density, traffic flows, and distribution can facilitate more accurate implementation of time-based charging, parking flow adjustment, and optimized parking management. Lastly, fire emergency simulation tools can display fire equipment and escape routes to support emergency events and training so personnel can quickly and accurately understand the situation and setting.
Real Estate Module
Real estate is sometimes overlooked during the operational stage due to its absence in a traditional AM/FM scope. However, with the introduction of the Digital Twin, the industry’s bar has been raised, along with the owners’ expectations. Real estate currently plays a vital role in buildings like shopping centers, residential and commercial structures. Through the space, monitoring, and leasing-related data analysis tools, the Real Estate Management Module facilitates the sales and lease of the project space and provides comprehensive leasing management by integrating it with the ERP system. It offers crucial data, such as real-time rental income, growth rate and fluctuation, space rental status, rental risk analysis, and sales status.
The space analysis tool provides screening and analysis of sales and leasing management under different conditions, such as sales status, lease status, area, price, floor, and orientation. Through various visualization tools, the manager can view and digest the analysis results and project data in the most intuitive form to spot problems and room for improvement in a timely manner.
The space monitoring tool can help managers quickly locate the tenant with overdue rent and its corresponding space and view related space information, displaying prompts in different colors according to the severity. Using a more extended period time frame, managers can analyze the number of historical alarms and display the results of overdue occurrences within the selected period to quickly and accurately locate high-risk tenants and spaces needing more accurate management methods.
The leasing-related data analysis tool helps quickly correlate rental key parameters, statistics, and analysis of critical income indicators in the selected period, such as the total income amount, unit income amount, space rental status, etc. It can enable analyzing and mining in different dimensions, combining management methods, avoiding risks, and increasing the property’s total revenue.
Sustainability Module
The Sustainability Management Module focuses on addressing the synergetic management of the facility’s equipment and space, along with occupants’ wellbeing. While each facility might have its own defined sustainability goals and indicators, these objectives can typically be grouped under three areas: Building Efficiency (energy and water consumption), Building Comfort (occupancy and productivity), and Building Health (environmental wellbeing).
These multiple competing factors affecting different aspects of sustainability performance are the intricate part of sustainability management. The management of equipment alone is no longer sufficient; it is necessary to consider how the equipment serves the space’s functionality. Comfort and health thresholds become part of operational criteria to determine the management strategies. Therefore, the core objective of this module is to provide an integrated platform to support facility managers with related data, translated performance indicator values, and trade-off analyses for informed decision-making based on their predefined performance priority logic.
Its foundation includes an exhaustive list of assets and building components along with their sustainability-related attributes and real-time usage data, as well as their location properties to determine their correlation performance thresholds. Building on top of these data foundations, the platform integrating IoT, building automation system, and CMMS can provide insightful information to support sustainability management or automate the O&M based on predefined logic.
For example, when an occupancy sensor detects an office space is not in use, the platform can automatically shut off the lights to reduce lighting usage, turn down the outdoor air rate to minimize HVAC operation, and close shades to reduce the solar heat gain. The platform can also provide visualization for different sustainability performance indicators to facilitate HCI and gather that data for future operational reference.
Summary
This installment of Practical BIM Implementation for Facility Management has broken down the five essential application modules in an ideal Digital Twin platform. Each module represents an aspect of a holistic facility management approach that is highly interrelated to the others. Modular data analytics and reporting give us the freedom to perform quantification analysis on each focus area in the facility in terms of space, sustainability, safety, operation, and maintenance. This practice informs the end-user with straightforward information about the facility’s performance by building, floor, or any predefined space via the scoring system. The next segment will disassemble each facility’s health category into sub credits, present a high-level picture of the scoring system, and discuss its collaboration with the AM/FM LOD.


专注更加智慧的未来探寻CIM的无限可能


网站备案/许可证号:京ICP备18030106号